Measure the Output of the Sharp IR Distance Sensor Exercise
GTA Marking
This is an assessed laboratory exercise. Upon completing all practical tasks, verify that your work satisfies the
Note
Before beginning software implementation, verify that the Sharp IR distance sensor is securely mounted to the robot chassis, as shown in
The following video provides a quick demonstration of the expected outcomes for this exercise:
Introduction and Background
The aim of this exercise is to experimentally characterise the Sharp IR sensor and draw a graph of the measured output against measurement distance. During this exercise, you will interface the Sharp IR distance sensor with the Arduino's ADC, record the measured output voltage as a function of the distance to a target, and evaluate operational limitations—specifically the minimum detection threshold and dynamic range.
!!!! note "Hardware Assembly Checklist"
Before proceeding with this exercise, you must ensure that the circuit is constructed in accordance with
Noise on the IR sensor
The IR sensor is not an ideal sensor. As can be seen from
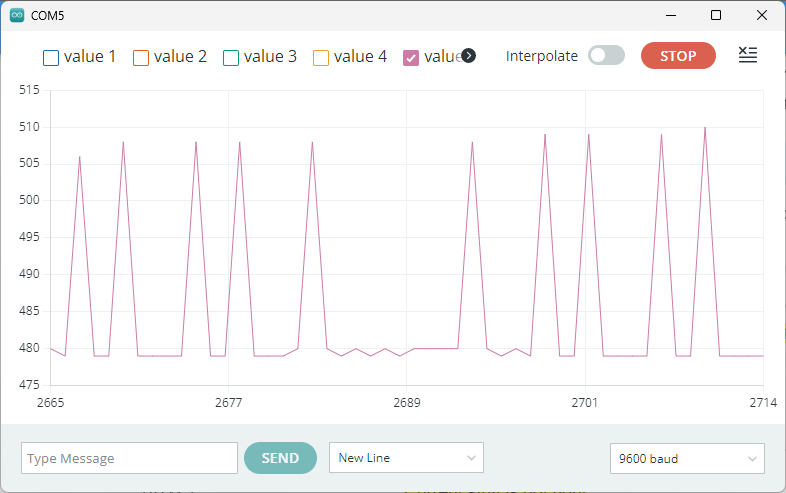
A
//Read the IR sensor
irVal = analogRead(irPin);

// accumulate a further 7 readings
irVal = irVal + analogRead(irPin);
irVal = irVal + analogRead(irPin);
irVal = irVal + analogRead(irPin);
irVal = irVal + analogRead(irPin);
irVal = irVal + analogRead(irPin);
irVal = irVal + analogRead(irPin);
irVal = irVal + analogRead(irPin);

// right shift 3 places to divide by 8
irVal = irVal >> 3;
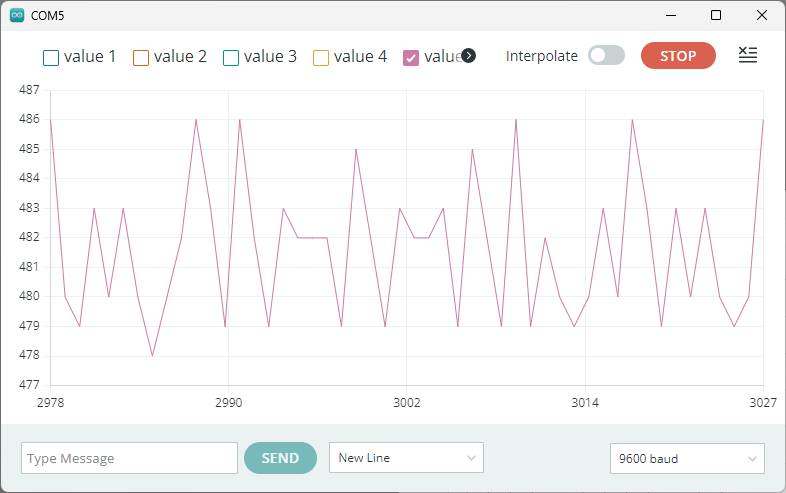
Comparing the noise magnitude superimposed on the raw IR sensor measurement in
Experimental Setup with Lolly Stick up
The IR sensor is sensitive to picking up reflections from any surface that it is operating. It has been found from experimentation, that raising the sensor above the surface (operating plane) produces improved and more consistant results.
As a result, when using the IR sensor, you should ensure that the lolly stick assembly is in the upright position, as shown in the righthand figure in the
Component Data Sheets and Technical Documentation
For more details on concerning the pin connections for the Sharp GP2Y0A21YK0F distance measurement sensor, see the data sheet for the sensor on the Blackboard site:
ACS231 Blackboards Site>>Mechatronics Kit Information>> Component Data Sheets and Technical Documentation.
Expected Results
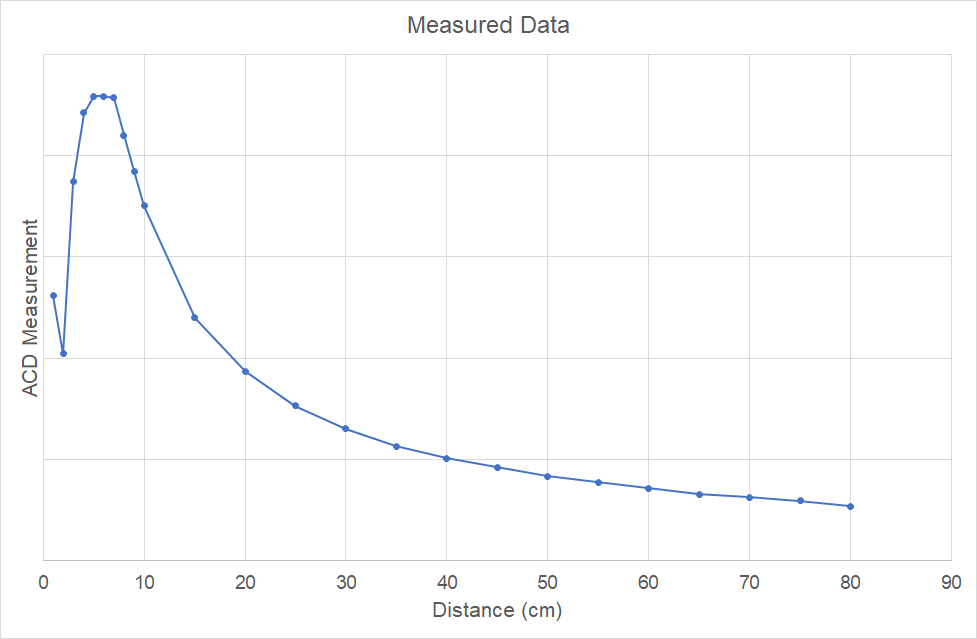
The IR sensor has a non-linear distance to output voltage characteristic, as illustrated in
Assessed Exercise
For this assessed exercise you will develop an Arduino sketch to sample the output of the IR sensor and display the ADC value of on the serial monitor. The distance measurements should be taken at STATIC positions, using a series of measurement points at:
1cm, 2cm, 3cm, 4cm, 5cm, 6cm, 7cm, 8cm, 9cm, 10cm, 15cm, 20cm, 25cm, 30cm, 35cm, 40cm, 45cm, 50cm, 55cm, 60cm, 65cm, 70cm, 75cm, and 80cm
You will collect static calibration data and generate a plot using a software analysis tool (such as Microsoft Excel, MATLAB, or Python/Matplotlib). The resulting plot must display Target Distance (\(\text{cm}\)) on the horizontal (\(x\)) axis and ADC Reading on the vertical (\(y\)) axis.
Procedure:
- Develop the Acquisition Sketch: Using the POT.ino sketch as a template, write an Arduino sketch to sample the output of the IR distance sensor, incorporating the 8-sample moving avarage filter, and stream the results to the serial monitor.
- Prepare Measurement Fixture: Position the robot chassis level surface. Align a ruler or tape measure along the sensor's optical axis. Ensure no adjacent obstacles infringe on the sensor's field of view.
- Record the Sensor Output at Different Distances: For all of the distance measurements, listed above, record and tabulate the ADC measurement values.
- Plot Sensor Transfer Function: From this dataset, plot the results for Target Distance (\(\text{cm}\)) on the horizontal (\(x\)) axis and ADC Reading on the vertical (\(y\)) axis.
- Demonstrate and Obtain Sign-Off: Present your resulting graph to a GTA for assessment and demonstrate the operation of your working system.
Exercise Assessment
What we expect to see from your demonstration?
When completed, your code should allow you to run an experiment to draw the following graph:
- A graph of ADC measurement value against distance.
- The graph should be correctly framed within the axes.
- Appropriate axes labels, with units and a descriptive graph title.
You should plot your results in a computer package, such as Microsoft Excel, MATLAB, or Python/Matplotlib, with the x-axis as the distance measured, and the y-axis as the ADC measurement value, as illustrated in
Fig 3
We expect you to also demonstrate the operation of your code and the output on the Serial Monitor, as describes in the procedure.
Now Get Your Work Marked by a GTA
Once you have completed your code and are satisfied with its operation, you should show your work to a GTA for marking.